Researchers conducting ELISA experiments have likely encountered these frustrating moments:
Failure to detect low-concentration samples at all, with abnormally high values in blank wells;
Poor standard curve fitting, substandard correlation coefficients, leading to questioned research data;
Severe interference from biological matrices causing systematic bias in detection results and low data credibility.
Many people focus on product prices when selecting kits, while ignoring key performance validation indicators in the instructions.
Sensitivity (Limit of Detection, LOD)
The lowest analyte concentration at which a kit can distinguish negative samples from positive test samples. It is usually calculated as the mean of 20 blank well detections plus 3 times the standard deviation. As a core indicator of the kit’s trace analysis capability, it directly determines the kit’s ability to detect low-abundance biomarkers.
Myth: The lower the sensitivity value, the better the kit performance.
In fact, over-optimizing detection sensitivity increases non-specific antigen-antibody binding, elevates background OD values, compresses the effective detection window, and 反而 impairs quantitative accuracy for medium and high-concentration samples.
Detection Range
The concentration range where analyte concentration shows good linear correlation with the OD value detected by a microplate reader, enabling accurate quantification. It is divided into the Lower Limit of Quantification (LLOQ) and Upper Limit of Quantification (ULOQ). Detection results within this range follow the dose-dependent relationship of immune reactions.
If the analyte concentration exceeds the upper quantification limit, the immune reaction enters a plateau phase where OD values no longer rise with increasing concentration, causing the Hook effect and falsely low results. If the concentration is below the lower limit, detection failure or unreliable values will occur.
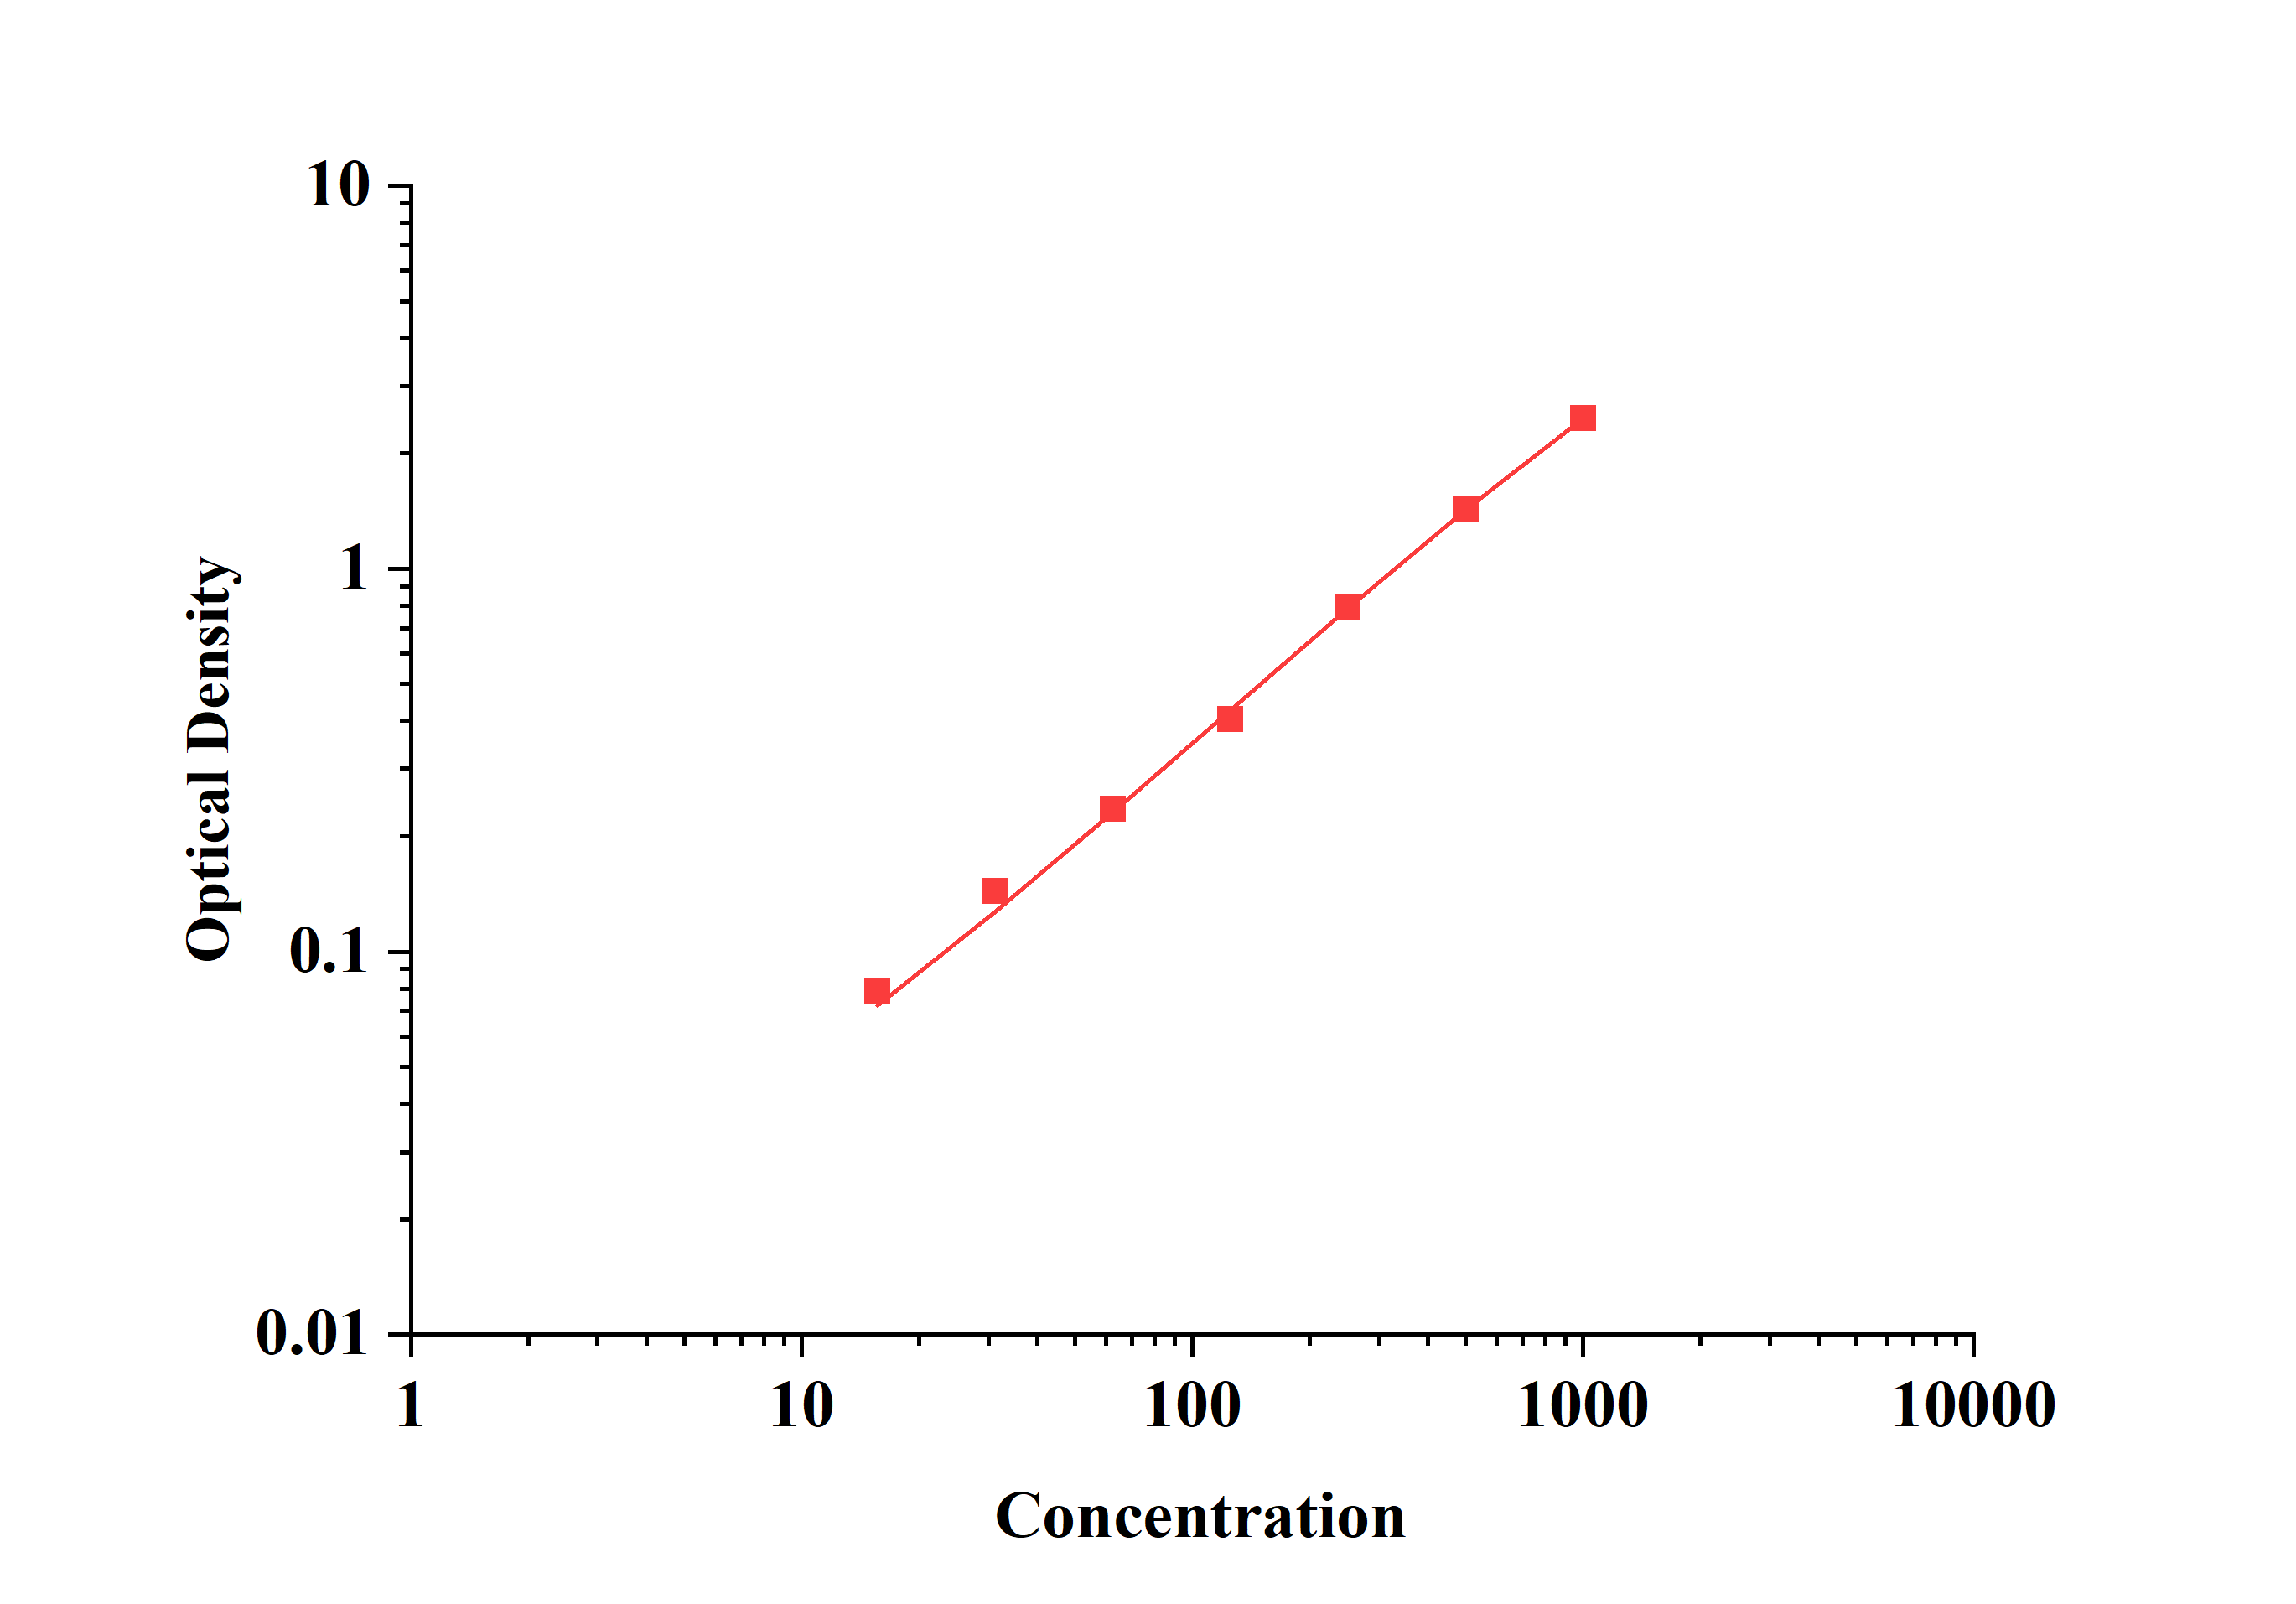
Linearity and Linear Correlation Coefficient (R²)
Linearity describes the linear dependence between gradient concentrations of standards and corresponding absorbance values. The linear correlation coefficient R² quantifies the fitting degree, reflecting the linear consistency of detection signals with changes in analyte concentration. Generally, a high-quality standard curve with full-point fitting requires R² ≥ 0.990, and the relative deviation between measured and theoretical values of each gradient standard ≤ 5%.
Avoidance Tip: Meeting the R² standard alone does not guarantee qualified linearity. The dispersion of each point on the standard curve must also be verified. If the overall R² is acceptable but low/high concentration endpoints deviate significantly, quantitative results for threshold samples will be distorted.
Spiked Recovery Rate
Evaluates the degree of biological matrix interference on the detection system and the kit’s quantitative accuracy. A known concentration of standard analyte is added to the sample, and the spiked recovery rate is calculated as the ratio of measured concentration to theoretical spiked concentration. For complex biological matrix systems such as serum, plasma, and tissue homogenate, the industry-accepted qualified range is 80%–120%.
Core Value: Biological samples contain endogenous interferents, heterophilic antibodies, hemolytic/lipemic impurities. The recovery rate directly reflects the kit’s anti-matrix interference capability. Substandard recovery leads to systematic bias in quantitative results, making data untrustworthy for scientific research.
Precision (Coefficient of Variation, CV)
Precision characterizes the repeatability and reproducibility of kit detection results, evaluated using the Coefficient of Variation (CV = standard deviation/mean × 100%). It is divided into:
•Intra-assay precision (intra-batch CV): reflects parallel detection stability on the same microplate
•Inter-assay precision (inter-batch CV): reflects detection consistency across different microplates and reagent batches
Reed Biotech Advantages: ELISA production lines use automated liquid handling stations for coating, blocking, and washing, achieving full-process automation of liquid handling without human intervention. This fundamentally eliminates uncertainties from manual operations, tightly controls batch differences, and ensures both intra-batch and inter-batch CV of all kits are less than 8%.
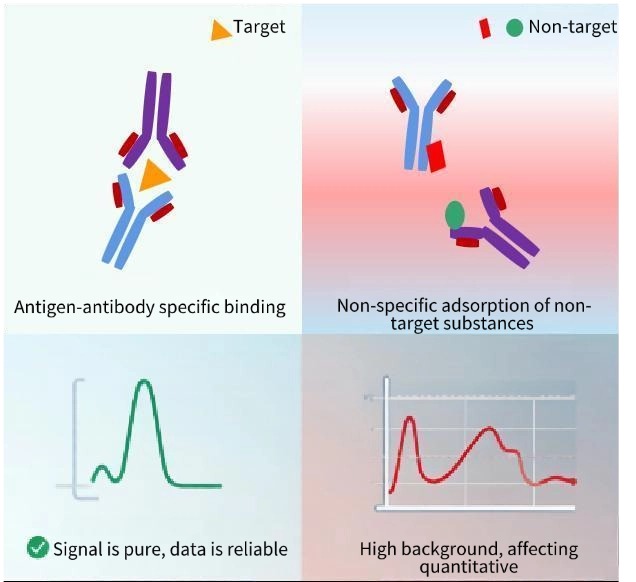
Specificity (Cross-Reactivity Rate)
The ability of the kit’s coated antibody and detection primary antibody to specifically recognize only the target analyte without non-specific immune binding to homologous structural proteins or family-related markers in samples. It is usually quantified by cross-reactivity rate: the lower the cross-reactivity, the stronger the kit specificity. Insufficient antibody specificity leads to non-specific capture of homologous interfering proteins, causing false-positive elevation in detection results and directly distorting experimental grouping differences and conclusions.
Common Misconceptions
Myth 1: The lower the sensitivity, the better the kit detection performance.
Correction: Overly low detection limits increase background absorbance, reduce signal-to-noise ratio, and decrease quantitative precision for medium and high-concentration samples. Indicator matching to the experimental system is far more important than extreme parameters.
Myth 2: Linear correlation coefficient R² ≥ 0.99 is sufficient for experimental requirements.
Correction: R² only represents overall fitting degree. It must be comprehensively evaluated with relative deviations of each standard gradient. Severe endpoint deviation still results in quantification failure.
Myth 3: Recovery rate infinitely close to 100% indicates a qualified kit.
Correction: Biological immunoassays have inherent matrix errors; 85%–115% is the optimal industry range. A recovery rate approaching 100% likely indicates artificial data fitting modification.
Priority Table of Kit Selection Parameters by Scenario
|
Experimental Sample & Application Scenario |
Core Priority Verification Parameters |
|
Detection of cytokines, low-abundance trace biomarkers |
Limit of detection, background OD value, intra-assay precision |
|
Complex matrix samples (serum, plasma, tissue homogenate, etc.) |
Matrix spiked recovery rate, antibody specificity |
|
Multi-batch repeated experiments, large-scale sample screening |
Inter-assay precision, batch production stability |
|
Samples with extremely wide concentration range (large high-low value difference) |
Effective quantitative linear range, full-gradient linear fitting degree |