How to Identify Abnormal Standard Curves in ELISA and How to Respond?
During the color development phase, the first four wells of the standard should show a clear blue gradient, and the maximum OD value of the standard should be ≥1.2. Additionally, the linear regression correlation coefficient (R²) of the standard curve should be ≥0.99 to be considered valid.However, abnormal standard curves are common in ELISA experiments. Below are several special cases, their causes, and corresponding solutions.
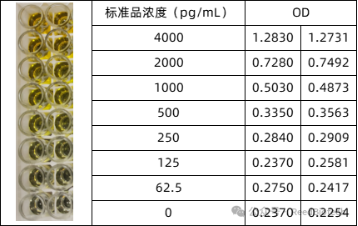
High Background
Although the standard curve shows a gradient and the maximum OD value is >1.2, the background is high and the four low-concentration wells near the blank do not separate well.
A. High Background Values
Improper Washing
Inadequate washing or skipping any step in the washing process can lead to high background. Check the volume of washing buffer and ensure all washing steps are completed. Make sure the buffer is properly diluted and used correctly.
Substrate Contamination
Ensure the substrate is not contaminated by metal ions or oxidizing agents. Keep some extra substrate as control; it should be colorless before use.
Substrate Exposure to Light
Light exposure can cause the substrate to turn blue. Store it in the dark (inside the reagent bottle) before use.
Incorrect HRP Dilution
Excessive HRP concentration can cause high background. Always dilute according to the product instructions.
Incorrect Incubation Time or Temperature
Follow the product manual strictly for incubation times and temperatures.
B. Poor Separation in Low Concentration Gradient
Contamination or Improper Pipetting
Contaminated samples/reagents or improper pipetting may cause cross-contamination between adjacent wells.
Solution: Replace reagents and operate carefully.
Incomplete Plate Washing
Before washing, discard antibody solution thoroughly. Fill each well with wash buffer to ensure proper cleaning.
Excess Antibody Causing Non-Specific Binding
Use antibody at the recommended concentration; dilute appropriately.
2 No Signal Across the Plate in One Experiment
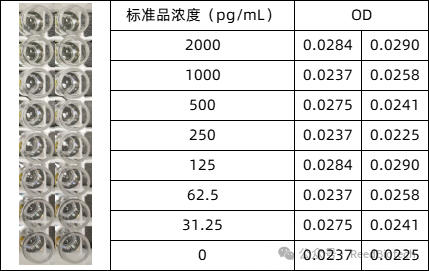
The standard curve shows no color development, and there's no OD gradient.
Possible Causes:
The kit is expired or stored improperly.
HRP enzyme is contaminated, reducing activity and titer.
Operational errors, such as reversing the addition order of biotinylated antibody and enzyme conjugate.
Mixing reagents from different kits when testing multiple targets (e.g., standard, plate, antibody).
Neither standard nor sample shows color development
Suggested Action:
To quickly identify the issue, mix 10 μL of substrate solution with 2 μL of concentrated HRP. Check for color change and take a photo of the result.
If the mixture turns dark blue/blue-green, the HRP enzyme and TMB substrate are not contaminated.
In this case, prepare a new standard curve using a fresh plate, avoiding the above errors.
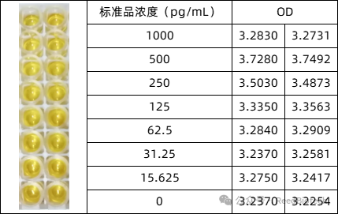
3 Entire Plate Turns Yellow
Possible Causes:
A competitive ELISA was performed using a sandwich ELISA protocol.
Improper washing: insufficient wash buffer per well, too few washing cycles, overflow causing contamination, or too short soaking time.
Substrate stored improperly, not protected from light during incubation, or reagent contamination leading to non-specific color development.
Causes and Solutions:
Sample Concentration Too High:Dilute the sample. Refer to literature or contact technical support to determine the optimal dilution factor via a pilot test.
Improper Sample Handling or Storage (including interfering endogenous substances):Ensure proper sample collection and storage; avoid repeated freeze-thaw cycles.
Matrix Effect:Diluting the sample can help reduce matrix effects.